


| Shanghai Releases First Air Quality Maps | |||||||||||
|
|||||||||||
http://english.dbw.cn
2015-06-05 11:07:24
|
|||||||||||
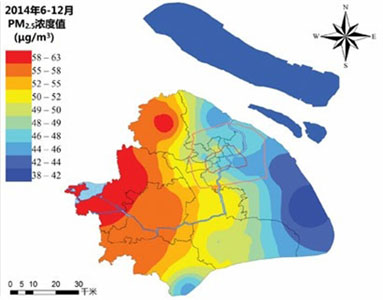  The Shanghai Environmental Protection Bureau releases two air quality maps on June 4, 2015, to show Shanghai's PM2.5 density for the latter half of 2014, and also the city's PM10 density for 2014. The two maps, together with maps of sulfur dioxide density and nitrogen dioxide density, provide local residents with up-to-date air quality information on Shanghai. [Photo: Wen Wei Po] Shanghai's Environmental Protection Bureau has released a series of air quality maps to both help local residents get informed of the air quality in Shanghai and raise public awareness of environmental protection, the Shanghai-based Wen Wei Po reports on June 4, 2015. The release of the maps comes ahead of World Environment Day on June 5th. The air quality maps contain coverage of the main air pollutants in Shanghai, including PM2.5, PM10, sulfur dioxide or SO2 and nitrogen dioxide or NO2.The maps show the Chongming Three-island area and Pudong's Dishui Lake area are the least affected by the four pollutants. It's believed this is because of the fewer factories and vehicles in those areas, as well as their geographic locations. The PM2.5 maps do show that only the Chongming Tree-island area and the north part of Dishui Lake have achieved national standards for PM2.5. The data in the maps is collected from a newly built, citywide air quality monitoring system. It includes 50 separate air quality monitoring stations. The system provides real time air quality readings. Local environment authorities in Shanghai say that the air quality maps will be released to the public on a regular basis in the future.
|
|||||||||||
| Author: Source: CRI Editor: Yang Fan |
|||||||||||


